
Rakvere · Apartment building

Lennuki tn 8, Rakvere — building data and flat estimate

Built 1966 · 4 floors · 48 apartments · EHR 108012336 · Cadastre 66301:034:0200

Lennuki tn 8 (Rakvere) is a 4-storey apartment building completed in 1966 with 48 flats. It is managed by Lennuki tn 8 apartment association (registry code 80069075). Estiq's model estimates flats here at €930–1 288/m² (typically €1 109/m², as of 28.10.2026). This is not a licensed appraisal. In Rakvere city, 89 flats in buildings of the same era sold over the last four completed quarters.
Estimated market value
€1 109 /m²
€930 range ±16.1% €1 288
Typical apartment · 39.2 m²
€43 473
Building score
7.3 / 10
Energy class
C in register
latest certificate 18.02.2020 · 2011567/00270
Buying or selling an apartment at Lennuki tn 8?
Pre-purchase check (€149) before you make an offer (we take no fee from the seller or the seller's broker), or a free broker analysis for owners to assess the sale price (a partner broker may pay Estiq a referral fee).
See expert support →
Automated model estimate (AVM), not a professional valuer's appraisal · as of 28.10.2026 · Land Board notarial transactions
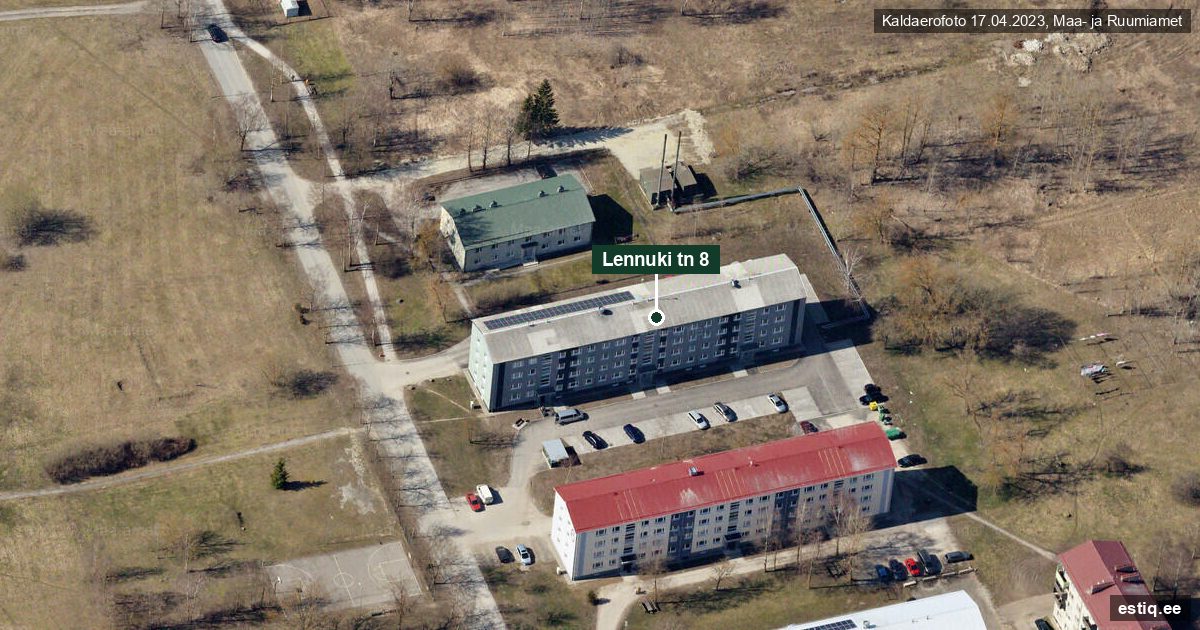
Lennuki tn 8, Rakvere – kaldaerofoto vaade lennukilt
View from the air · oblique aerial photo 17.04.2023: Maa- ja Ruumiamet (open data licence) · Request removal of this photo
Lennuki tn 8, Rakvere – aerial photo and EHR building outline
Aerial photo · building outline from the Building Register (EHR) · Orthophoto 17.04.2023, Maa- ja Ruumiamet (open data licence)
Location map · CARTO Voyager · © OpenStreetMap contributors

Prices by apartment type

Type Count Area €/m² Value range
1-room 1 29,6 m² €1 109 €28 000 – €38 000 (median area 29,6 m²)
2-room 35 38,5–51,5 m² €1 109 €36 000 – €50 000 (median area 39,2 m²)
3-room 12 47,8–51,5 m² €1 109 €45 000 – €62 000 (median area 48,0 m²)
Actual value depends on the floor, interior finish, balcony/terrace, storage and parking space.

Find your apartment

48 apartments in the building

Pick an apartment from the dropdown and press “Value apartment” to open the model-based apartment-level estimate report.

Model-based analysis built on real EHR and transaction data.

The area at a glance · Lennuki tn 8

On foot
Environment
Tap an indicator to see it on the map
Details, sources and limits

Around Lennuki tn 8 (within 1.5 km): nearest public transport stop: Arkna tee stop (319 m, 4 min on foot); nearest grocery store: Meie Nord kaubahall (616 m, 8 min on foot); nearest park or green area: Rahvaaed (1188 m, 16 min on foot); nearest school: Rakvere Vabaduse Kool (772 m, 10 min on foot); nearest kindergarten: Rakvere Rohuaia lasteaed (913 m, 12 min on foot). Distances are straight-line, walking time assumes 4.5 km/h. Police open data list 19 recorded incidents in the surrounding ~0.7 km² cell over 24 months (incident level: high). Estimated road noise at the building is 50 dB (Lden). Radon in soil gas: high (50–100 kBq/m³). These describe the area, not a specific apartment.

Transit Arkna tee stop 319 m · Raudteejaam stop 334 m · Rakvere stop 334 m
Grocery stores Meie Nord kaubahall 616 m · Biore 997 m · Maxima X 1053 m
Parks and green areas Rahvaaed 1188 m
Schools Rakvere Vabaduse Kool 772 m · Rakvere Eragümnaasium 801 m
Kindergartens Rakvere Rohuaia lasteaed 913 m · Eralasteaed Kaur 1122 m
Radon in soil High · 50–100 kBq/m³. A soil-gas reading, not the flat’s indoor air; mainly relevant to basements and ground floors.
Noise Estimated level is within the WHO recommended level (53 dB Lden).
Incident level Counts incidents reported to the police for the surrounding ~0.7 km² cell, not how safe it feels.
The indicators describe the area, not a specific apartment. Sources: Estiq database (stops, shops, parks, schools, kindergartens; OpenStreetMap, EHIS), Environmental Agency (air), Police and Border Guard Board (incidents), Geological Survey of Estonia (radon), Estiq noise model. How we calculate this

Apartment association

Lennuki tn 8 · 48 flats · report 2025
Repair-fund balance €0
Cash on accounts €14 734
Bank loans €420 091
Association finances and reports →
Source: annual reports in the e-Business Register

Price trend and transactions: Rakvere city, built 1940-1970

Few local sales → wider district
Notarial transactions per Land Board data: Rakvere city · built 1940-1970 (compared with Rakvere city)
Rakvere city (1940-1970) Rakvere city (1940-1970) Transaction count Model forecast
€1 091 /m²
1 400 1 100 800 500 2025 Q1: 13 notarial transactions (Rakvere city) 13 2025 Q2: 13 notarial transactions (Rakvere city) 13 2025 Q3: 20 notarial transactions (Rakvere city) 20 2025 Q4: 24 notarial transactions (Rakvere city) 24 2026 Q1: 21 notarial transactions (Rakvere city) 21 2026 Q2: 19 notarial transactions (Rakvere city) 19 2026 Q3: 25 notarial transactions (Rakvere city) 25 Rakvere city (2025 Q1): €1 248 /m² (13 deals) Rakvere city (2025 Q2): €617 /m² (13 deals) Rakvere city (2025 Q3): €789 /m² (20 deals) Rakvere city (2025 Q4): €979 /m² (24 deals) Rakvere city (2026 Q1): €1 097 /m² (21 deals) Rakvere city (2026 Q2): €1 074 /m² (19 deals) Rakvere city (2026 Q3): €1 091 /m² (25 deals) Rakvere city (2025 Q1): €1 248 /m² (13 transactions) Rakvere city (2025 Q2): €617 /m² (13 transactions) Rakvere city (2025 Q3): €789 /m² (20 transactions) Rakvere city (2025 Q4): €979 /m² (24 transactions) Rakvere city (2026 Q1): €1 097 /m² (21 transactions) Rakvere city (2026 Q2): €1 074 /m² (19 transactions) Rakvere city (2026 Q3): €1 091 /m² (25 transactions) 2026 Q4 (forecast): €1 113 /m² (mudelprognoos) 2025 Q1 2025 Q2 2025 Q3 2025 Q4 2026 Q1 2026 Q2 2026 Q3 Q4 prognoos
View detailed quarterly statistics (8 quarters) ▾
Quarter Rakvere city €/m² Rakvere city €/m² Transactions (pcs)
2025 Q1 €1 248 €1 248 13 deals
2025 Q2 €617 €617 13 deals
2025 Q3 €789 €789 20 deals
2025 Q4 €979 €979 24 deals
2026 Q1 €1 097 €1 097 21 deals
2026 Q2 €1 074 €1 074 19 deals
2026 Q3 €1 091 €1 091 25 deals
2026 Q4 (forecast) €1 113 – –
Due to limited transaction volume in Lennuvälja district subdistrict for cohort 1940-1970 (<3 quarters), aggregated district data for Rakvere city is shown: YoY trend —, activity steady at 13–25 deals per quarter.

Evidence and calculation basis (EHR & Land Board)

Quarterly transaction prices (Land and Spatial Development Board)

8 quarters
Quarter Rakvere city (€/m²) Rakvere city (€/m²) Notarial transactions
2025 Q1 €1 248 €1 248 13 deals
2025 Q2 €617 €617 13 deals
2025 Q3 €789 €789 20 deals
2025 Q4 €979 €979 24 deals
2026 Q1 €1 097 €1 097 21 deals
2026 Q2 €1 074 €1 074 19 deals
2026 Q3 €1 091 €1 091 25 deals
2026 Q4 (forecast) €1 113 – –

Registry data (EHR and cadastre)

8/8 fields filled in register (completeness, not verification)
Year built 1966
Apartments in building 48
Floors / lifts 4 floors
Structure small or large blocks (foam, aerated, lightweight-aggregate, honeycomb concrete etc.)
Heating district heating; local heating
Plot 3 095 m² · residential land 100%
EHR code 108012336
Cadastre 66301:034:0200

Frequently asked questions

8
What do apartments at Lennuki tn 8 cost?
As of 28.10.2026, the Estiq model baseline at Lennuki tn 8 is €1 109/m² (range €930–1 288/m², ±16.1%).
How many apartment sales were there in Rakvere city?
Land and Spatial Board transaction statistics show 89 apartment sales in Rakvere city in the last four completed quarters, in buildings of the same era (1940-1970).
Are sale prices for flats at Lennuki tn 8 public?
The Land and Spatial Board publishes transaction statistics by area, not by address. Estiq therefore shows sales in same-era buildings (1940-1970) in Rakvere city: 89 in the last four completed quarters. The price level for this building is a model estimate, not a sale price.
What are the association's finances at Lennuki tn 8?
From the association's 2025 annual report (reg. code 80069075): 48 flats, repair-fund balance €0, bank loans €420 091.
Does the online estimate replace a bank valuation (EVS 875)?
No. The Estiq figure is a statistical model estimate. For a mortgage the bank requires a licensed valuer's report under EVS 875.
Which sources does the data for Lennuki tn 8 come from?
Building data comes from the Estonian Register of Construction Works (EHR), transaction statistics from the Land and Spatial Board, association finances from annual reports filed with the Business Register, and the estimate from the Estiq market database. Latest data as of 28.10.2026. Methodology: https://estiq.ee/en/methodology.
What are the nearest shop, school, park and transit stop to Lennuki tn 8?
Around Lennuki tn 8 (within 1.5 km): nearest public transport stop: Arkna tee stop (319 m, 4 min on foot); nearest grocery store: Meie Nord kaubahall (616 m, 8 min on foot); nearest park or green area: Rahvaaed (1188 m, 16 min on foot); nearest school: Rakvere Vabaduse Kool (772 m, 10 min on foot); nearest kindergarten: Rakvere Rohuaia lasteaed (913 m, 12 min on foot). Distances are straight-line, walking time assumes 4.5 km/h.
What is the area around Lennuki tn 8 like: safety, air, noise and radon?
Police open data list 19 recorded incidents in the surrounding ~0.7 km² cell over 24 months (incident level: high). Estimated road noise at the building is 50 dB (Lden). Radon in soil gas: high (50–100 kBq/m³). These describe the area, not a specific apartment.
Estiq partners: certified valuers and brokers

How can we help you at Lennuki tn 8?

Data-driven property analytics and partner brokers in Rakvere. Choose a service:

My connection to the building:

Need the full dataset or professional help?

All data on this page, earlier transaction years, detailed plans and paid expert services.

Lennuki tn: apartment buildings and association costs

2 buildings · median €1 174/m² · built 1965–1966 · median association cost 0,82 €/m²/mo (1 associations)

Lennuki tn
Address Built €/m² Typical flat Energy Assoc. €/m²/mo Flat / month Association
Lennuki tn 2 1965 €1 239 ~€48 693 D – – –
Lennuki tn 8 · this building 1966 €1 109 ~€43 473 C 0,82 – KÜ report 2025 →

Association cost comes from the latest filed annual report (€/m² per month and the median flat’s monthly payment); for an association managing several buildings the figure is association-wide. “–” means no reliable report or estimate. €/m² is an Estiq market-database estimate and the typical flat follows the building’s typical unit; “~” beside an energy class marks an estimate from construction year.